

Agricultural and farm machinery company Titan (NSYE:TWI) announced better-than-expected revenue in Q1 CY2025, with sales up 1.8% year on year to $490.7 million. On the other hand, next quarter’s revenue guidance of $475 million was less impressive, coming in 2.1% below analysts’ estimates. Its GAAP loss of $0.01 per share was significantly below analysts’ consensus estimates.
Is now the time to buy Titan International? Find out by accessing our full research report, it’s free.
Titan International (TWI) Q1 CY2025 Highlights:
- Revenue: $490.7 million vs analyst estimates of $464.2 million (1.8% year-on-year growth, 5.7% beat)
- EPS (GAAP): -$0.01 vs analyst estimates of $0.06 (significant miss)
- Adjusted EBITDA: $30.82 million vs analyst estimates of $27.54 million (6.3% margin, 11.9% beat)
- Revenue Guidance for Q2 CY2025 is $475 million at the midpoint, below analyst estimates of $485.3 million
- EBITDA guidance for Q2 CY2025 is $30 million at the midpoint, below analyst estimates of $30.71 million
- Operating Margin: 2.4%, down from 6.5% in the same quarter last year
- Free Cash Flow was -$53.62 million compared to -$14.6 million in the same quarter last year
- Market Capitalization: $468.2 million
Paul Reitz, President and Chief Executive Officer stated, "There are no other manufacturers in our industry with the domestic production capabilities of Titan. This means that tariffs applied consistently across the globe should benefit us because many of our competitors have significantly greater exposure to tariffs due to their higher dependence on overseas production. With the breadth of our product portfolio combined with our global platform, we are nimble and the best suited in our industry to meet our customers' long-term needs in a dynamic market landscape. We are actively assessing the evolving situation and will make timely decisions on supply chain and production plans that are the result of data driven analysis and our evaluation of longer-term trade policy."
Company Overview
Acquiring Goodyear’s farm tire business in 2005, Titan (NSYE:TWI) is a manufacturer and supplier of wheels, tires, and undercarriages used in off-highway vehicles such as construction vehicles.
Agricultural Machinery
Agricultural machinery companies are investing to develop and produce more precise machinery, automated systems, and connected equipment that collects analyzable data to help farmers and other customers improve yields and increase efficiency. On the other hand, agriculture is seasonal and natural disasters or bad weather can impact the entire industry. Additionally, macroeconomic factors such as commodity prices or changes in interest rates–which dictate the willingness of these companies or their customers to invest–can impact demand for agricultural machinery.
Sales Growth
A company’s long-term performance is an indicator of its overall quality. Any business can put up a good quarter or two, but many enduring ones grow for years. Unfortunately, Titan International’s 6.1% annualized revenue growth over the last five years was mediocre. This was below our standard for the industrials sector and is a rough starting point for our analysis.
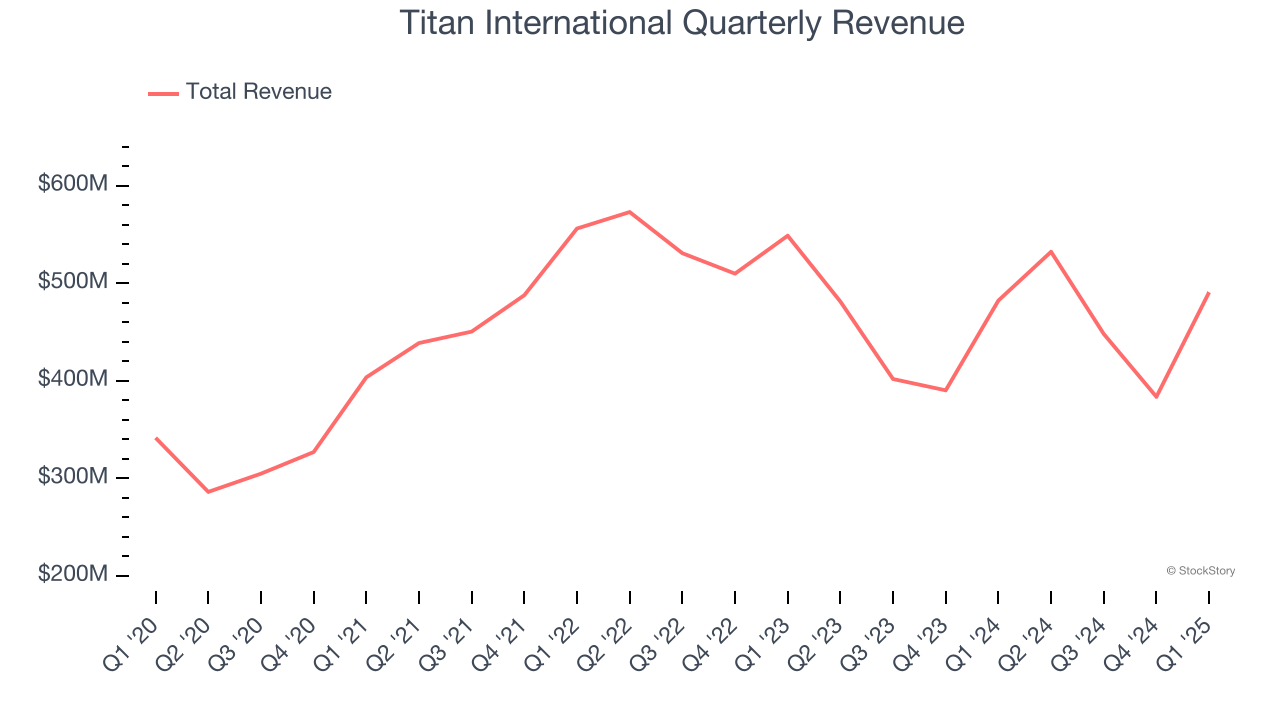
Long-term growth is the most important, but within industrials, a half-decade historical view may miss new industry trends or demand cycles. Titan International’s performance shows it grew in the past but relinquished its gains over the last two years, as its revenue fell by 7.4% annually. Titan International isn’t alone in its struggles as the Agricultural Machinery industry experienced a cyclical downturn, with many similar businesses observing lower sales at this time. 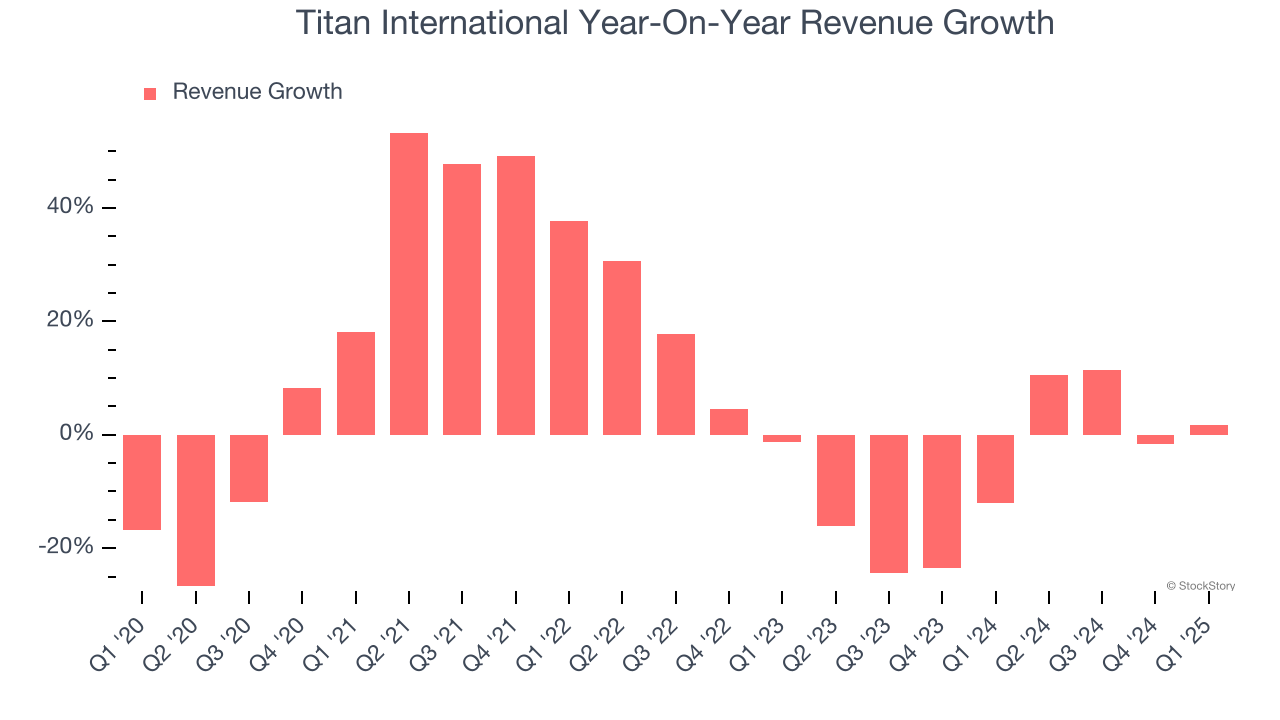
This quarter, Titan International reported modest year-on-year revenue growth of 1.8% but beat Wall Street’s estimates by 5.7%. Company management is currently guiding for a 10.7% year-on-year decline in sales next quarter.
Looking further ahead, sell-side analysts expect revenue to grow 1.1% over the next 12 months. Although this projection indicates its newer products and services will fuel better top-line performance, it is still below average for the sector.
Unless you’ve been living under a rock, it should be obvious by now that generative AI is going to have a huge impact on how large corporations do business. While Nvidia and AMD are trading close to all-time highs, we prefer a lesser-known (but still profitable) stock benefiting from the rise of AI. Click here to access our free report one of our favorites growth stories.
Operating Margin
Operating margin is one of the best measures of profitability because it tells us how much money a company takes home after procuring and manufacturing its products, marketing and selling those products, and most importantly, keeping them relevant through research and development.
Titan International was profitable over the last five years but held back by its large cost base. Its average operating margin of 5.3% was weak for an industrials business. This result isn’t too surprising given its low gross margin as a starting point.
Looking at the trend in its profitability, Titan International’s operating margin might fluctuated slightly but has generally stayed the same over the last five years. This raises questions about the company’s expense base because its revenue growth should have given it leverage on its fixed costs, resulting in better economies of scale and profitability.
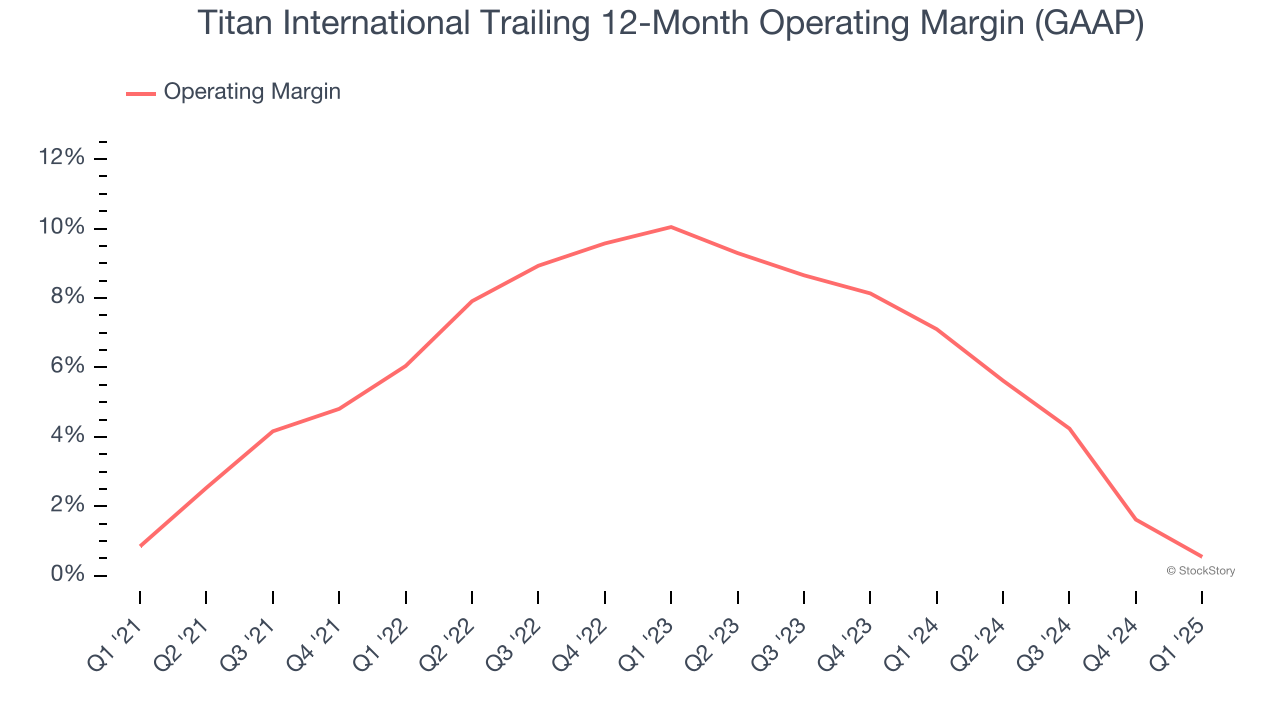
In Q1, Titan International generated an operating profit margin of 2.4%, down 4.1 percentage points year on year. Since Titan International’s operating margin decreased more than its gross margin, we can assume it was less efficient because expenses such as marketing, R&D, and administrative overhead increased.
Earnings Per Share
We track the long-term change in earnings per share (EPS) for the same reason as long-term revenue growth. Compared to revenue, however, EPS highlights whether a company’s growth is profitable.
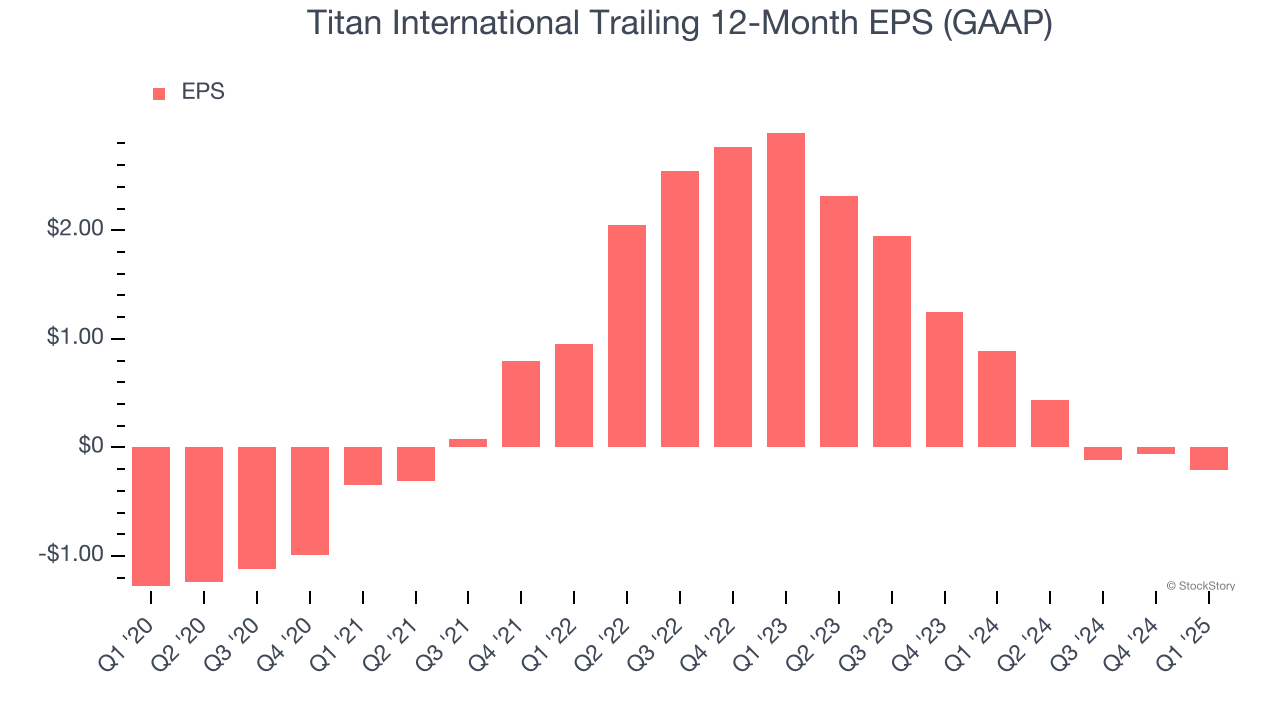
Although Titan International’s full-year earnings are still negative, it reduced its losses and improved its EPS by 30.3% annually over the last five years. The next few quarters will be critical for assessing its long-term profitability.
Like with revenue, we analyze EPS over a shorter period to see if we are missing a change in the business.
Sadly for Titan International, its EPS declined by more than its revenue over the last two years, dropping 44%. This tells us the company struggled to adjust to shrinking demand.
We can take a deeper look into Titan International’s earnings to better understand the drivers of its performance. Titan International’s operating margin has declined by 7.6 percentage points over the last two years. This was the most relevant factor (aside from the revenue impact) behind its lower earnings; taxes and interest expenses can also affect EPS but don’t tell us as much about a company’s fundamentals.
In Q1, Titan International reported EPS at negative $0.01, down from $0.14 in the same quarter last year. This print missed analysts’ estimates. Over the next 12 months, Wall Street is optimistic. Analysts forecast Titan International’s full-year EPS of negative $0.21 will reach break even.
Key Takeaways from Titan International’s Q1 Results
We were impressed by how significantly Titan International blew past analysts’ EBITDA expectations this quarter. We were also excited its revenue outperformed Wall Street’s estimates by a wide margin. On the other hand, its EPS missed and its revenue and EBITDA guidance for next quarter fell short of Wall Street’s estimates. Overall, this quarter was mixed. The stock remained flat at $7.35 immediately after reporting.
So do we think Titan International is an attractive buy at the current price? If you’re making that decision, you should consider the bigger picture of valuation, business qualities, as well as the latest earnings. We cover that in our actionable full research report which you can read here, it’s free.