
The collapse in the gold market does not look to be a bubble situation given the intrinsic value actually moved higher faster than other assets.
However, the rapid rise did spike volatility, leading to a round of long liquidation by global investment traders.
Don’t Miss a Day: From crude oil to coffee, sign up free for Barchart’s best-in-class commodity analysis.Much of this money found its way over to crude oil, oddly enough, just before the US went to war against Iran. How fortunate.
In mid-February, I discussed the question of if gold and silver were bubble markets. My conclusion, based on the continued strength Cash Indexes in relation to futures, was no, neither should’ve been considered bubbles at that time. Yet here we are 6 weeks down the road and both markets have melted down, raising the question, why? For this discussion, I’ll set aside my Market Rule #5: It’s the what, not the why; and pretend to be a normal member of the commentary industry and make up reasons for recent market moves. This should be fun.
Before we get going, let me define a “bubble market”. A quick question sent to the all-knowing interest receives the AI generated response, “A market bubble occurs when asset prices (stocks, real estate, commodities) rise rapidly far beyond their intrinsic value, driven by investor euphoria, speculation, and herd behavior rather than fundamentals. What’s scary is this is a better definition than the one I’ve used over the decades: When a market loses connection to its underlying cash value (intrinsic value). We can track this by following the basis market (cash minus futures) or spot futures spread (spot month minus first deferred futures contracts).
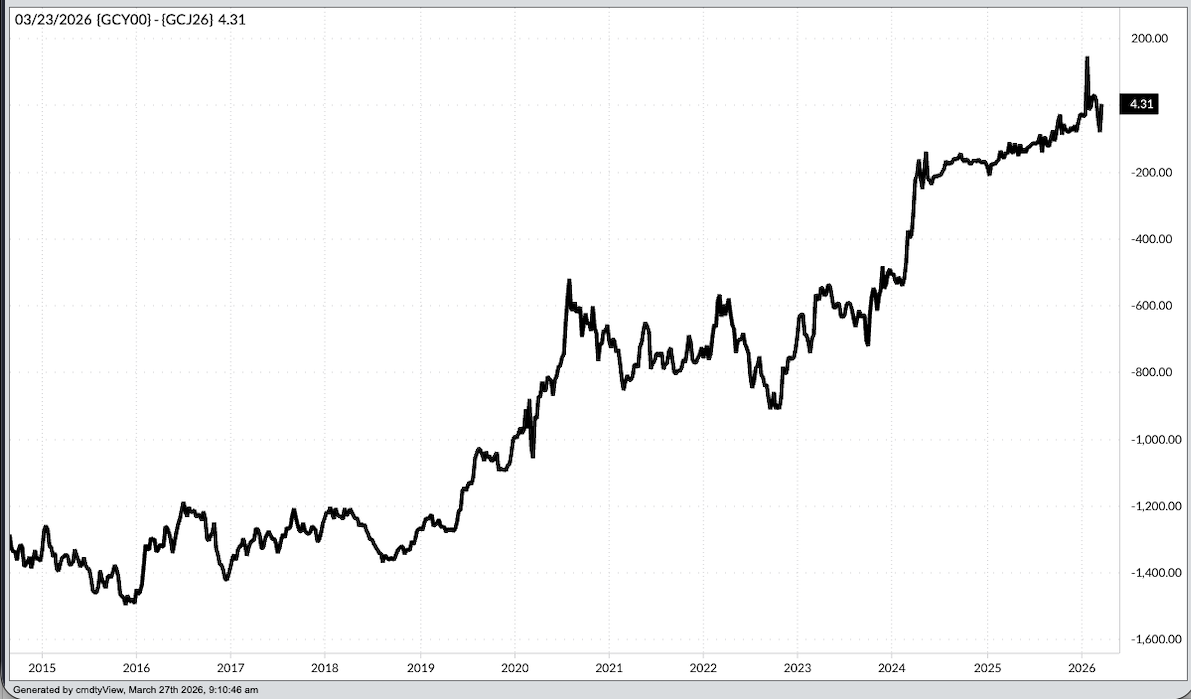
I didn’t see this happening in either gold or silver back in mid-February. In fact, a look at the weekly close-only chart for the gold Cash Index (GCY00) minus April futures (GCK26) shows the Index had spiked to $147 over April futures by late January before pulling back a bit. The bottom line is cash has stayed strong in relation to futures, thereby breaking the first tenant of a bubble market, even though the rest of the definition certainly applied.
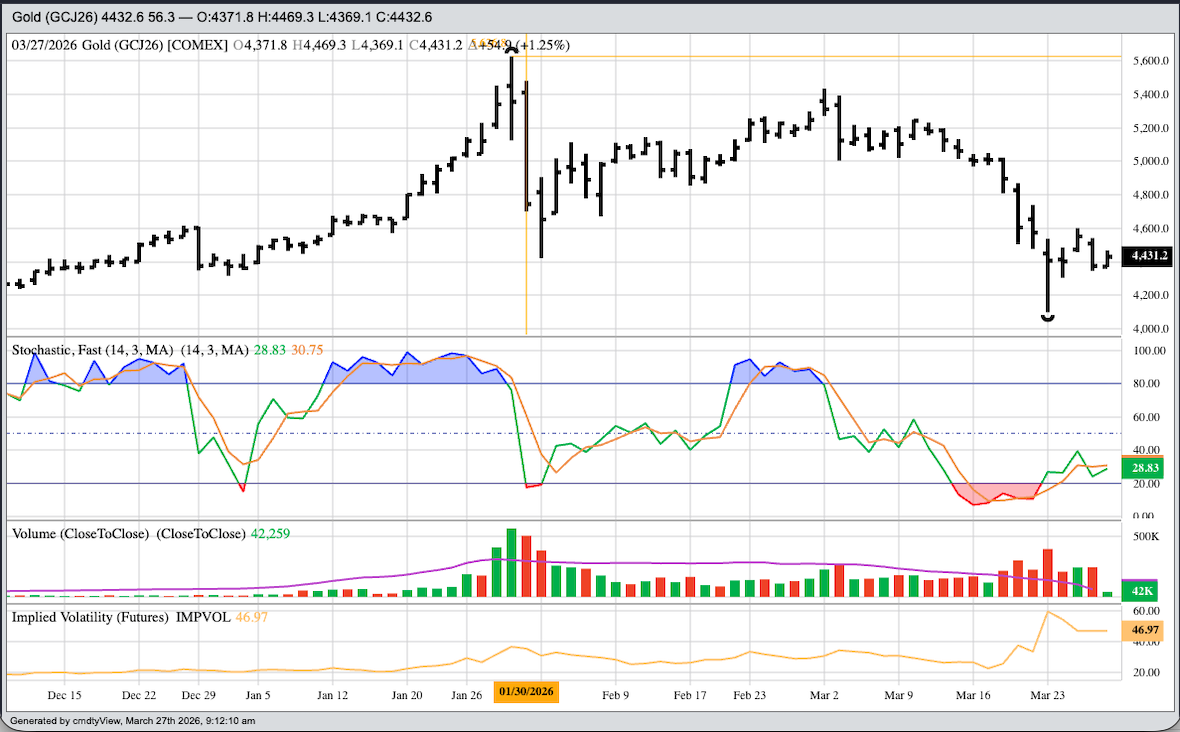
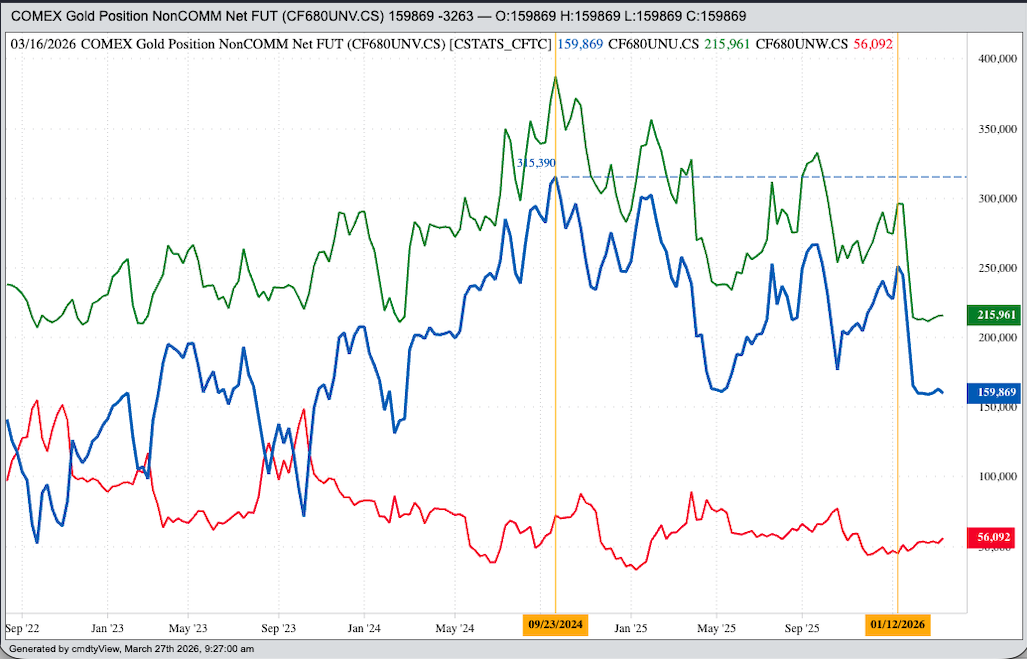
Why, then, is the gold market falling? After the April futures contract posted its high of $5.626.80 on January 29, it quickly fell into a short-term downtrend on its daily chart. Where did the pressure come from? A look at weekly Commitments of Traders report (legacy, futures only) chart shows the noncommercial long futures position peaked at 296,183 contracts on Tuesday, January 13 before falling to a recent low of 211,649 contracts on Tuesday, February 24. Similarly, the noncommercial net-long futures position (long futures contracts minus short futures contracts) posted a high of 251,238 that same week of January 13 and low of 159,177 contracts the week of February 24.
What is my conclusion? The gold market rallied so far so fast that despite the continued strength of the underlying cash market, trading algorithms started liquidating long holdings in the market, possibly due to risk parameters created by volatility, moving money to other commodity complex sectors or specific markets. Where did at least some of the money find a new home? I’m glad you asked.
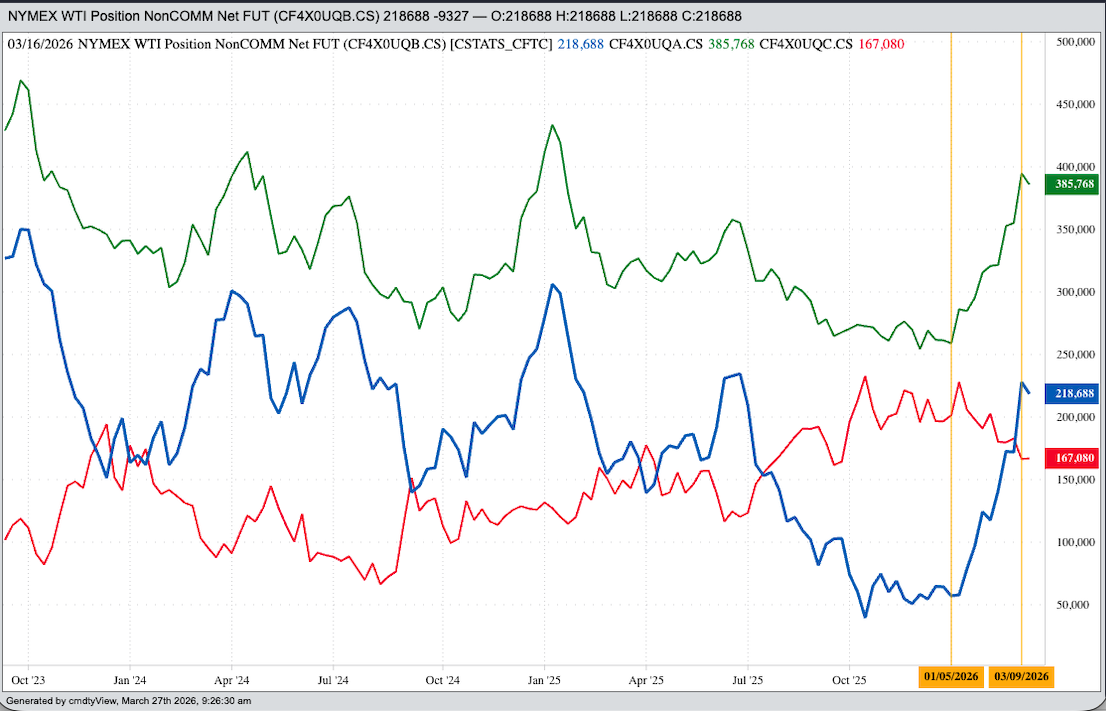
Take a look at the same Commitments of Traders chart for WTI crude oil. On Tuesday, January 6 the noncommercial net-long futures position was 57,352 contracts, including long futures of 258,956 contracts. By Tuesday, March 10 these same positions had grown to 228,015 contracts and 394,651 contracts respectively. In other words, fund money changed markets. But why?
Let’s apply Occam’s Razor (the simplest answer is usually the best) to the process of making up reasons.
- As stated, volatility was high in gold and low in crude oil, relatively speaking. However, the US war on Iran has created a spike in crude oil market volatility, setting the stage for a potential round of long liquidation. Keep in mind the ebb and flow of investment money is fluid, not static.
- I’ve read where central banks have been selling gold to pay for crude oil and other physical energy prices due to the spike in prices caused by the US war on Iran. This is a possibility, with the Cash Index falling roughly the same as the more active futures market since January.
- It is also possible some of the pressure is tied to the$100 million in gold the US took (stole?) from Venezuela to give to US oil refiners, reportedly. Whose hands the money actually wound up in if this gold was sold is certainly up for speculation.
- Lastly, I’ve heard the US dollar index has become the safe-haven market of choice rather than gold. This is like saying one would rather ride into battle dressed like Lady Godiva than the Black Knight of yore. The US dollar has strengthened not because of its rising status as a safe-haven market, but because of the Fed fund futures ((ZQX26) forward curve showing the next move by the Federal Open Market Committee could be a rate hike this fall.
Is it all over for gold and silver? No, I don’t think so. When global investment money goes through another reallocation, it would not be surprising to see renewed buying interest in both metals. (Copper, as an economic indicator market, remains a question mark.)
On the date of publication, Darin Newsom did not have (either directly or indirectly) positions in any of the securities mentioned in this article. All information and data in this article is solely for informational purposes. For more information please view the Barchart Disclosure Policy here.
More news from Barchart